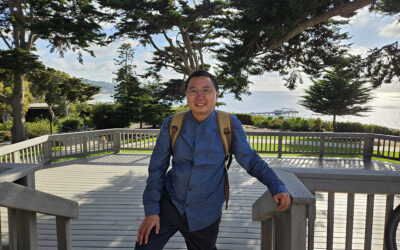
Ken McGwire, Ph.D., is an associate research professor of geography with the Division of Earth and Ecosystem Sciences at the Desert Research Institute in Reno. He specializes in environmental mapping, monitoring and modeling using satellite imagery and geographic information systems (GIS), software for viewing and analyzing geographical data. Ken came to DRI in 1994 from the University of California Santa Barbara, where he earned bachelor’s, master’s, and doctoral degrees in geography. In his free time, he enjoys skiing and backpacking in the Sierra Nevada.
DRI: What do you do here at DRI?
Ken McGwire: I study how things vary in space and across time in the environment, using satellite image analysis, computer mapping, and general database and programming skills. I came to DRI 25 years ago from U.C. Santa Barbara with degrees in physical geography, and what I’ve worked on here at DRI has been all over the place. There are so many cool interdisciplinary connections you can make here; I’ve found a lot of opportunities to apply the sorts of ways I look at the world to other disciplines.
I’ve worked on everything from 3-D imaging projects with paleontologists, to scanning images of ice cores, to working with virologists from the University of Nevada, Reno on epidemiology studies. I was a member of the science team for a NASA satellite mission called “Earth Observing 1,” looking at the ability to map invasive species with a type of technology called hyperspectral imaging. Lately, I’ve been doing a lot of work with some of the older, well-used satellite systems – making use of the long archive of historical observations to look at how the environment has varied and may be changing over time.
DRI: We understand that you’ve recently completed a detailed statewide map of all of Nevada’s wetland areas. Can you tell us about that project?
McGwire: Yes, about two years ago, I was awarded a grant from the US Environmental Protection Agency through the Nevada Natural Heritage Program, in collaboration with the Nature Conservancy, the Spring Stewardship Institute, and the Nevada Division of Wildlife, to develop a better understanding of the distribution of where wetlands are in Nevada, and to develop tools for characterizing how they change over time.
Different land management agencies define wetlands differently – the boundary for what the Forest Service uses to define a wetland may be different from what the Bureau of Land Management uses, for example. So, the first part of that project was to compile a statewide map of Nevada’s wetlands using data from multiple different agencies and sources. This map is now available on the DRI website.
A second part of that project was to develop a wetland analysis tool to help land managers and scientists from across the state better understand how various wetland areas have been changing over time. This tool, called WetBar, is used within the ArcMap GIS software package. It links the state wetland map with information about each wetland, and with an archive of satellite imagery dating back to 1985 that is available in Google Earth Engine.
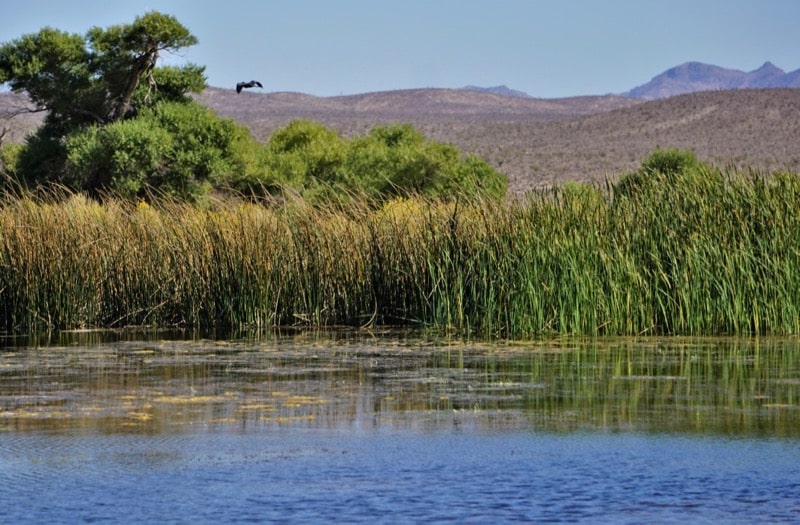
McGwire’s wetland map and WetBar ArcGIS analysis tool can be used to learn about how wetland areas in Nevada are changing over time. This wetland is located at The Nature Conservancy’s 7J Ranch Preserve near Beatty, Nevada.
DRI: How is this wetland analysis tool used? Can you give us an example?
McGwire: WetBar allows you to identify, group, and sort different wetland sites based on different criteria. I can use it to look at the boundary of a water body like Lake Mead, and how the shoreline of the lake has retreated or flooded over time. For example, using Landsat satellite imagery that goes back to 1985, I can use this tool to select only areas of the lake that have been flooded for 15 to 30 years, and create a map of just that area. This might help researchers get a feel for site conditions prior to visiting a field site, or help them to visualize the impacts of water withdrawals or changes in climate on a water body like Lake Mead.
There are a lot of other ways you can use this tool. You can sort all of the wetland areas in the database by climate sensitivity, based on how much the wetlands have changed in satellite imagery over the last three decades. This could help land managers to prioritize certain sites for protection, or determine how frequently a certain species can withstand flooding. You can use it to monitor reservoir depletion, or how long it takes a reservoir to fill. I recently received funding to provide outreach to people about what this toolbar can do, and try to get feedback on what other functions would make it more useful to decision makers, so more capabilities may be added as the project moves forward.
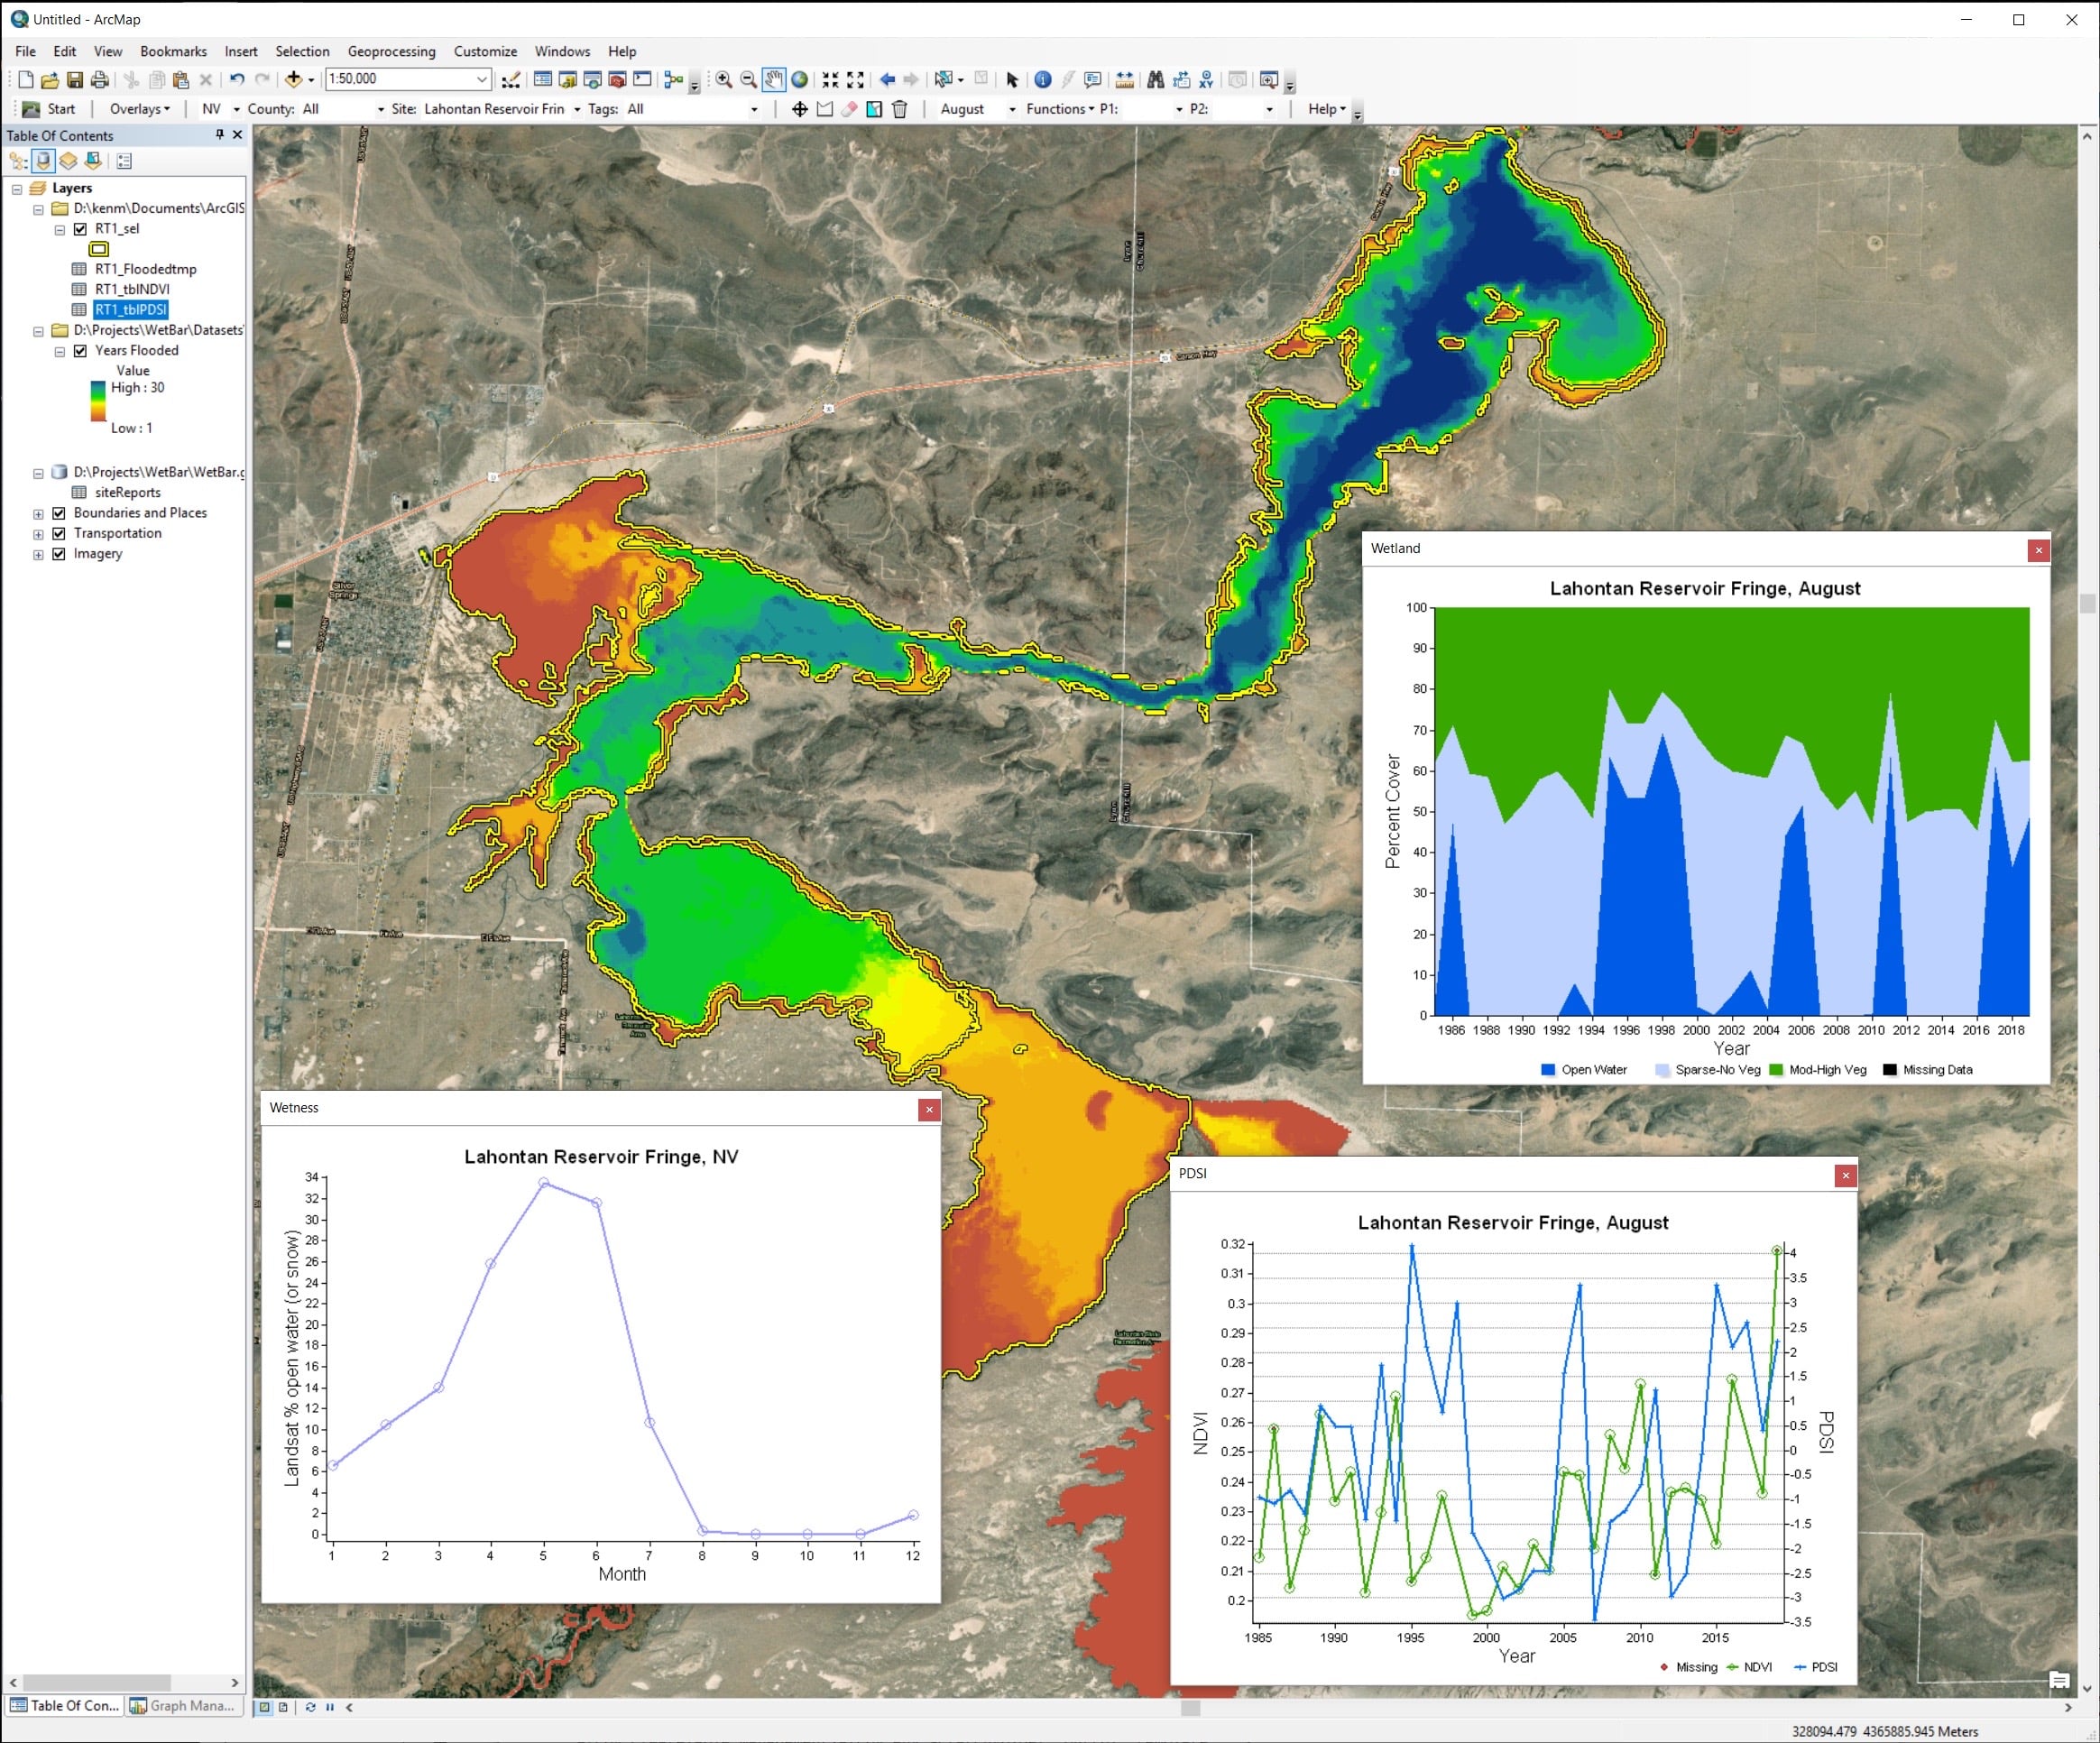
(Click to enlarge) Screenshot of a wetland map made using the WetBar ArcGIS toolbar. By linking satellite imagery to known data about various wetlands in Nevada, scientists can use this tool to learn about changes in water and vegetation cover over time.
DRI: Does your any of your work take you out into the field? McGwire: Yes, definitely. Most of my fieldwork in the last couple years has been supporting the Great Basin Unified Air Pollution Control District (GBUAPCD)’s efforts to control dust emissions from Owens Lake, which has become mostly a dry lakebed since the 1920s due to water diversion to Los Angeles. The lakebed is in a desert environment, and as the wind blows, clouds of sediment can blow toward Arizona. It was the biggest source of PM10 air pollution in the country for a while.
To mitigate the dust, GBUAPCD has developed a variety of land cover treatments. They’ve turned portions of the lakebed into detention areas, which can be shallow flooded. They do drip irrigation of saltgrass in areas that have natural vegetation, to try to get vegetation to establish and grow on the lakebed. They spread gravel in some areas, and in other areas they’re distributing some of the natural brines from the center of the lake to form a hard salt crust. So I’ve been working with the GBUAPCD to develop monitoring methods to monitor the status of these treatments, which requires creating maps of treatment areas, as well as field visits to monitor conditions on the ground.
What do you enjoy most about your line of work?
McGwire: Working with satellite imagery is very visual, and the scientific investigation aspect of what we do creates a lot of variety in terms of intellectual stimulation. There’s a creative aspect to it, a visual aspect to it, and I enjoy finding ways to make that sort of way of looking at the world useful to other people.
To learn more about Ken McGwire and his work, please visit his DRI directory page.