Mountain Rain or Snow reached an all-time high for submitted weather observations that will help scientists improve winter storm forecasting.
Mountain weather is famously unpredictable, with storms rolling in at a moment’s notice and one part of a mountain experiencing sleet while others nearby get rain or snow. Even small changes in elevation can impact the type of precipitation received from the same storm. Scientists are learning more about how winter storms change across time and space thanks to Mountain Rain or Snow, a NASA-funded partnership between DRI, UNR, Lynker, and thousands of community members across the country.
When a storm is expected, the Mountain Rain or Snow team sends community members who have signed up to receive alerts a reminder to submit observations. As the storm progresses, they can log into the project’s app and record real-time observations of rain, snow, or mixed precipitation falling at their location. Knowing when snow turned to sleet or rain can help scientists determine how temperature, humidity, wind speed, topography, and other factors play into precipitation changes.
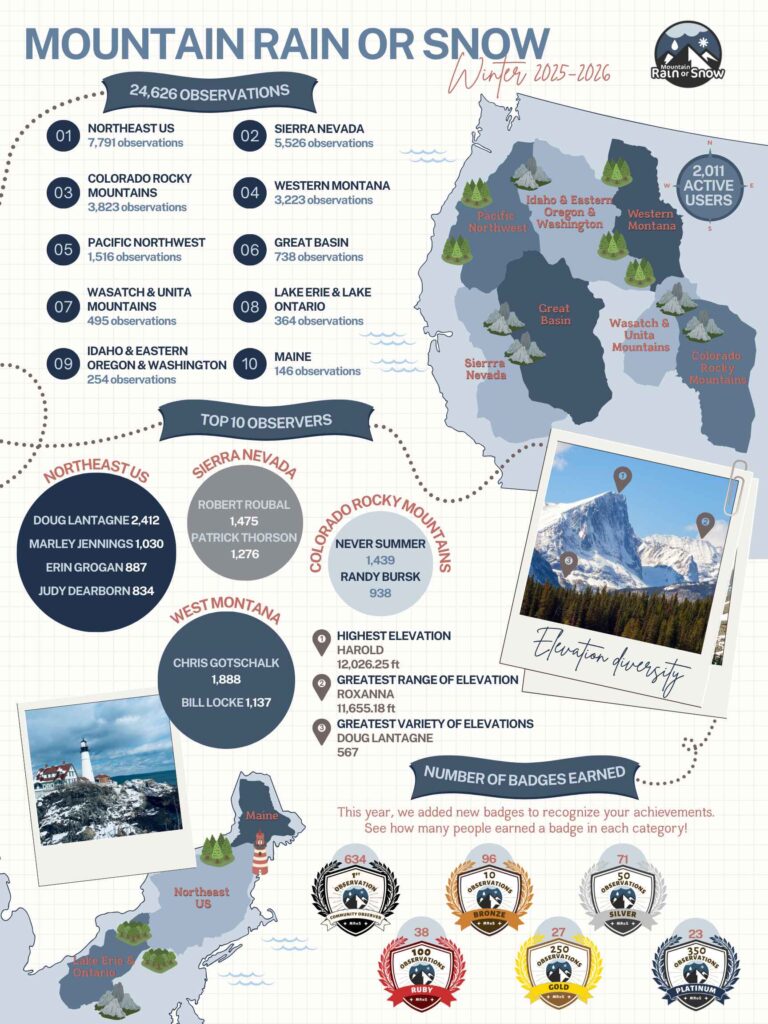
The project had their biggest winter yet! This year, 2,011 people across the nation recorded nearly 25,000 observations, bringing the project to 139,000 observations since its launch in 2020. All the data collected helps researchers improve winter storm forecasting, refine precipitation models, and better understand climate and weather patterns.
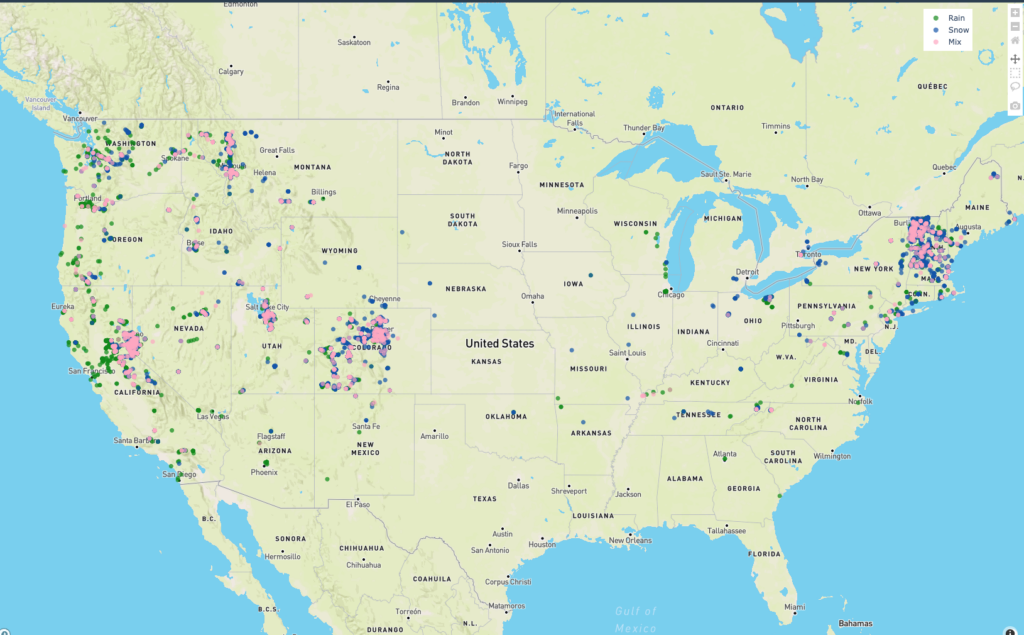
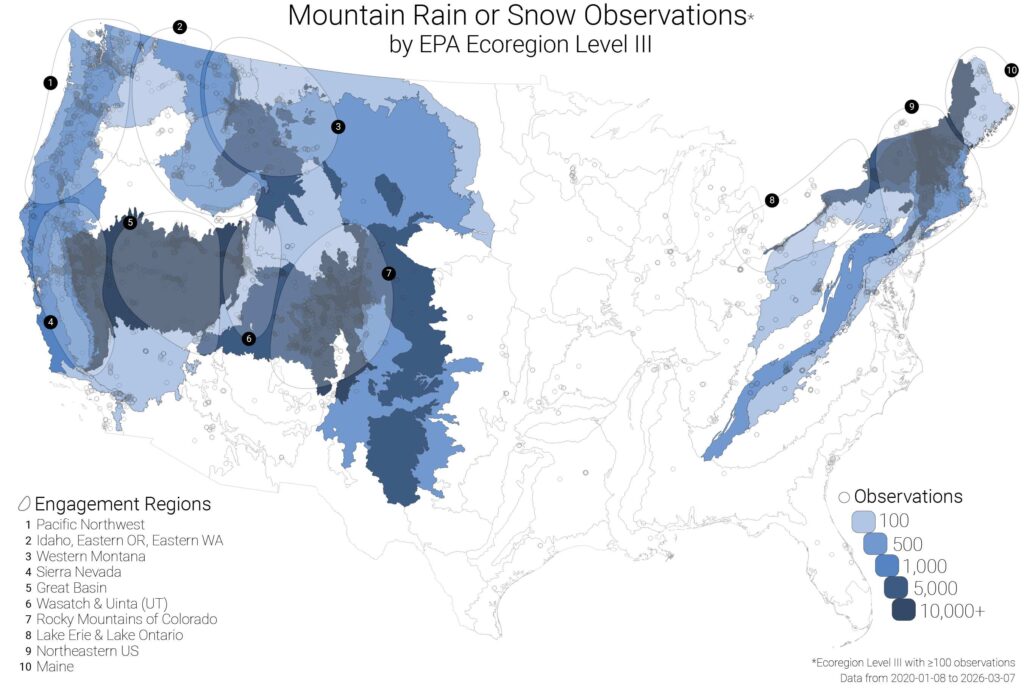
The Northeast led the nation with more than 7,700 observations, followed by the Sierra Nevada region with over 5,500 observations. Colorado and western Montana followed with more than 3,000 observations each. Check out the figure below for a more thorough breakdown, including leading observers in each region.
What did this winter look like across the U.S.? Read more in the project’s April Report by Luisa Ortega:
Report-back: Did any Mountain Rain or Snow regions break weather records this winter?
Precipitation patterns across the US during the 2025–2026 winter season highlighted a contrast between dry, warm western basins and storm-active eastern regions. The Mountain Rain or Snow season wrap-up provides an overview of the seasonal weather patterns across different project regions.
Eastern U.S.: Record high snowfalls and rapidly changing conditions
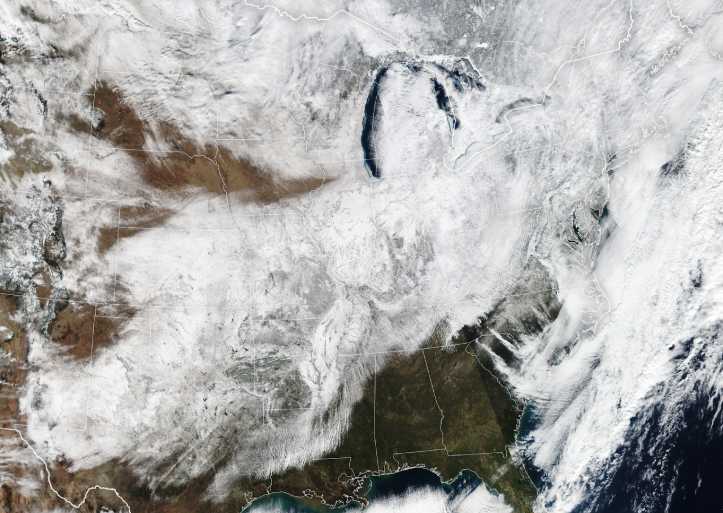
Snowfall records were set in Rhode Island and Boston, and hundreds of locations experienced snowfall in the top 1% of historical events (The Washington Post). For many observers contributing to the Mountain Rain or Snow project, rapid fluctuations in precipitation were visible on the ground. Reports frequently captured threshold conditions, where temperatures hovered just above or below freezing, resulting in rapid switches between rain, snow, and mixed precipitation. A large, multi-phase storm in late January 2026 impacted many areas in the Eastern U.S., including observers in the eastern Great Lakes and across Vermont, New Hampshire, Massachusetts, and Maine.
The brutal weather in the Eastern U.S. was shaped by La Niña and was the result of several factors, including polar vortices brought by a ridge in the jet stream (prevailing wind patterns). This moved Arctic air southward along with conditions ideal for forming powerful winter storms.
Western U.S.: Record dry and warm weather recorded
In contrast, large portions of the Western US experienced record or near-record low precipitation and snowpack (NOAA Snow Analysis, US Drought Monitor), ranking among the driest winters in decades. When winter storms did arrive, they were often warmer and with higher snowlines, producing rain at elevations that typically receive snow. This led to multiple rain-on-snow events and mid-season melting episodes, further reducing snowpack. Meanwhile, parts of the Midwest and Northeast experienced short but intense storms, with much of the season’s precipitation falling in just a few days, sometimes as heavy snow, and other times as mixed precipitation. Fluctuating temperatures delivered a wide range of precipitation types, including snow, sleet, freezing rain, and rain. Across the U.S., rapid transitions between rain, snow, and mixed precipitation within single storm events reinforced a key takeaway from this winter: precipitation was less consistent, more episodic, and increasingly sensitive to small temperature changes (National Centers for Environmental Information).
Observations from the various Mountain Rain or Snow project regions exemplify this past winter’s record-breaking patterns across the country. In Colorado, the statewide snowpack dropped to record-low levels as much precipitation fell as rain rather than snow, leaving some mountain basins near the 0th percentile snow-water equivalent by Dec. 25, 2025 (SNOTEL observations).
In the Sierra Nevada, rain dominated early across the region. For example, rain made up the first 1200 reports of the winter around Reno, NV. The first snow observation was not made until Dec 19th, and the majority of snow and mix reports occurred on or after Dec 24th.
Why it matters
When seasonal weather patterns depart from normal, sometimes marginal or threshold conditions are key to understanding why so many records were challenged or broken. This winter, even small temperature differences shifted precipitation type to either majority snowfall or majority rainfall, influencing whether storms contributed to snowpack or immediate runoff.
Additionally, this past winter season underscores a critical shift in winter precipitation, where records are no longer defined solely by how much precipitation falls, but by how it falls, how quickly it arrives, and how often it deviates from historical norms, especially in mountain environments (NOAA National Environmental Satellite, Data, and Information Service or NESDIS).
Mountain Rain or Snow’s committed observers are crucial to advancing and expanding our understanding of winter weather, its impacts, and, in the long run, our ability to be better prepared for anomalous winters like these.
Anyone can be a part of Mountain Rain or Snow by signing up to be a weather observer, just visit the website and click “sign me up now!”: https://www.rainorsnow.org/home
Can’t get enough science in your life and want to contribute even more? Support DRI with a donation, attend one of our events, or sign up for our monthly newsletter.