Project Ashfall
Demystifying wildfires with the help of community observers
Project Ashfall is a research initiative that asks community members to photograph wildfire ash in order to improve analyses of wildfires’ behaviors. This project is a way for those who are not at risk from current fires to contribute to the scientific knowledge that aims to strengthen our communities’ defenses and protect our natural spaces.
Radar has the potential to be a powerful contributor toward recognizing warning signs for destructive wildfire behaviors in near-real time and for understanding the underlying causes of these behaviors. However, radar’s use toward these important goals is currently limited by a lack of information about the properties of the smoke plumes that radar measurements describe.
That’s why researchers are asking for help. By contributing photos of wildfire ash, community members provide a snapshot of wildfire smoke plume properties, which is a missing puzzle piece for linking radar measurements with fire processes.
If wildfire ash falls near you, please take a photo and share it with our team by following the instructions below. Remember, Project Ashfall is intended to engage those who are not at risk from ongoing wildfires – safety is always the priority!
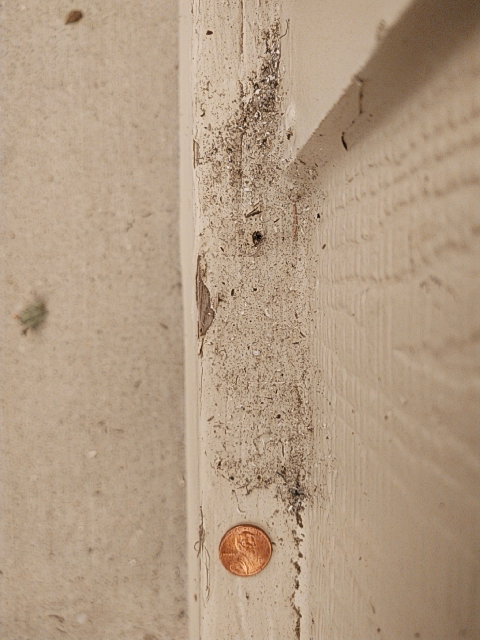
A photo of wildfire ash taken by one of Project Ashfall’s community observers.
How to Help
To participate in Project Ashfall, you will need to download the Survey123 app and then follow a link to access the project. Here are the steps:
- Download the Survey123 app: https://survey123.arcgis.app/
- Access Project Ashfall in Survey123. (Hint: Choose “Continue as a guest user” in the app.)
Fill out our form to share your email with us so we can send you updates about the research and upcoming events!
Making Quality Observations
When you see wildfire ash, place an object of standard size next to the ash (a coin, a ruler, etc.) and take a picture straight on, not at an angle, then submit your photos and corresponding information using the Survey123 app.
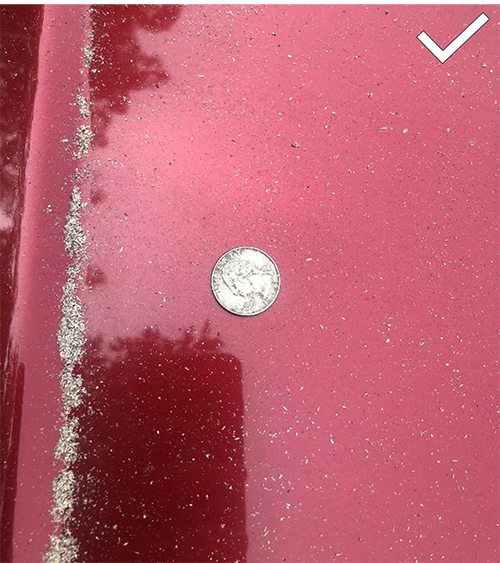
The photo above is an example of a high quality observation.
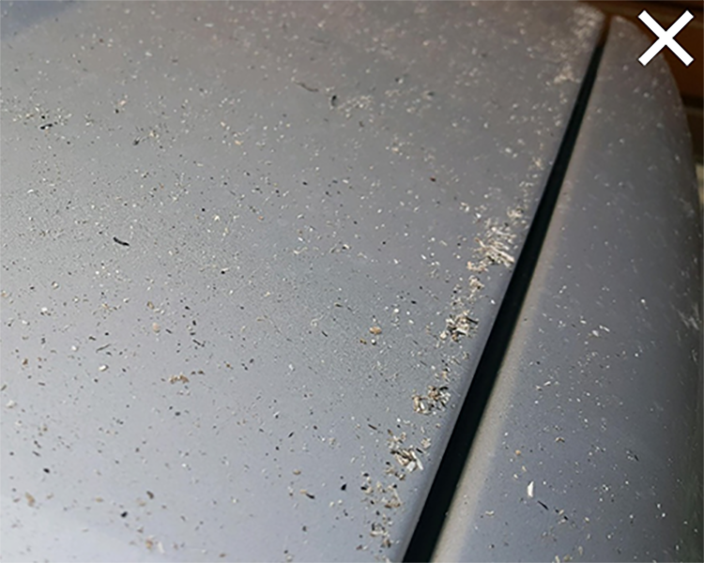
In contrast, this photo lacks a scale object and was taken at an angle, which makes determining the size of the ash pieces less reliable.
About the Science
The goal: Understand how radar measurements describe a wildfire’s behavior, in order to actionably recognize warning signs for destructive patterns and bolster our conceptual understanding of how and why these patterns form.
Radar is one of the most frequently used tools to study wildfires because it can be used to show movement and structure of smoke plumes. However, linking those smoke plume changes to the underlying wildfire’s behavior is something we cannot fully do yet, which limits the use of this important and highly available tool. To reach this goal, we need to understand how radar measurements of smoke plumes change when fire processes change.
The missing link? Ash. When wildfire ash is suspended in the smoke plume above a wildfire, the radar readings it returns are highly dependent on the characteristics of the ash pieces, especially size and shape. Since the properties of the ash are impacted by the fire’s behavior (like fuel type, power output, etc.), ash properties are a major clue for linking radar readings to fire processes. However, comprehensive, real-world studies of ash shape and size distribution for a wildfire smoke plume are lacking.
That’s where community observers can help. Knowing shape, size, and location of wildfire ash from geotagged photos submitted by community members, researchers can determine the characteristics of the smoke and ash plume at certain points in space and time, which will allow us to build models of how radar readings describe wildfires’ behavior and how this knowledge can be used to protect lives, property, and natural spaces.
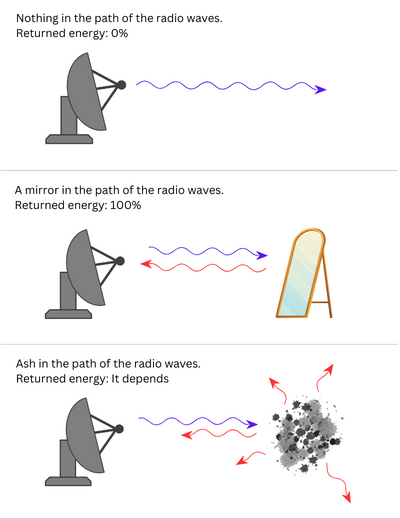
Radar works by sending out a radio wave and listening for a response. If there is something in the path of the radio wave, the wave may reflect back to the detector, but it may also be scattered in a different direction or absorbed. The amount of energy returned to the detector (called “radar reflectivity”) depends on the size and shape of the object and other characteristics like composition and how it is moving.
About the Project
This project is an NSF-funded collaboration between the University of Nevada, Reno and the Desert Research Institute. The project’s primary investigator is Dr. Neil Lareau at the University of Nevada, Reno (nlareau@unr.edu) and volunteer coordination is led by Meghan Collins at DRI (meghan.collins@dri.edu).
Contact
Please email Sonia Nieminen sonia.nieminen@dri.edu.
Sources
Aydell, T. B., & Clements, C. B. (2021). Mobile Ka-band polarimetric Doppler radar observations of wildfire smoke plumes. Monthly Weather Review, 149(5), 1247–1264. https://doi.org/10.1175/MWR-D-20-0198.1
Lareau, N. P., Nauslar, N. J., Bentley, E., Roberts, M., Emmerson, S., Brong, B., Mehle, M., & Wallman, J. (2022). Fire-generated tornadic vortices. Bulletin of the American Meteorological Society, 103(5), E1296–E1320. https://doi.org/10.1175/BAMS-D-21-0199.1