An Invisible Natural Disaster
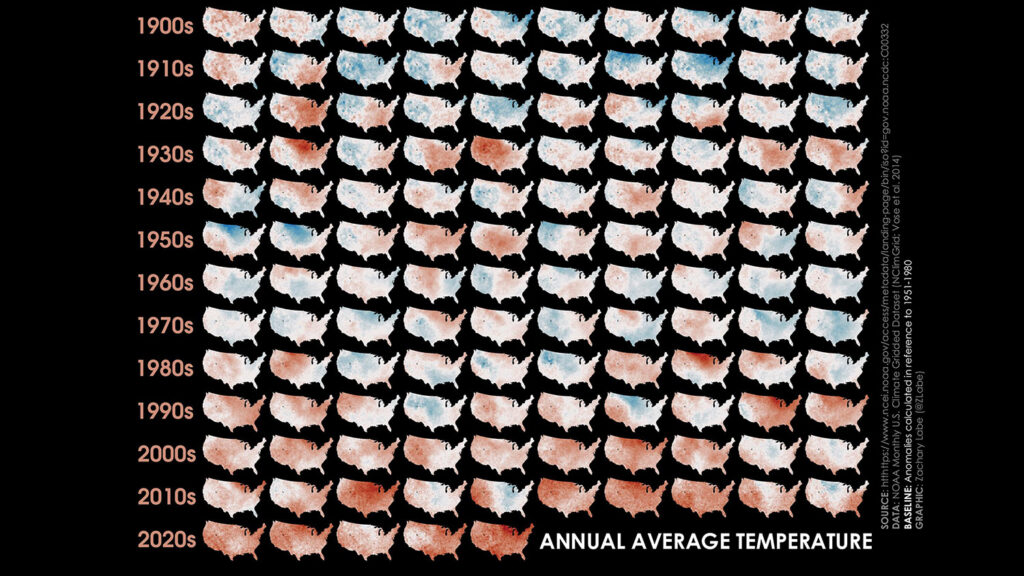
Earth is hotter than it has been in 125,000 years, and DRI scientists are striving to uncover the impacts of a warmer atmosphere.
Earth is hotter than it has been in 125,000 years, and DRI scientists are striving to uncover the impacts of a warmer atmosphere.

Earth is hotter than it has been in 125,000 years, scientists say, and Las Vegas continues to break temperature records. Planting and preserving the city’s street trees is one method that brings many benefits, from the cool air of their shade to their ability to store carbon. Now, a new study takes a deeper look at just how much trees can offer Sin City, as well as the water tradeoffs inherent in growing trees in a desert.
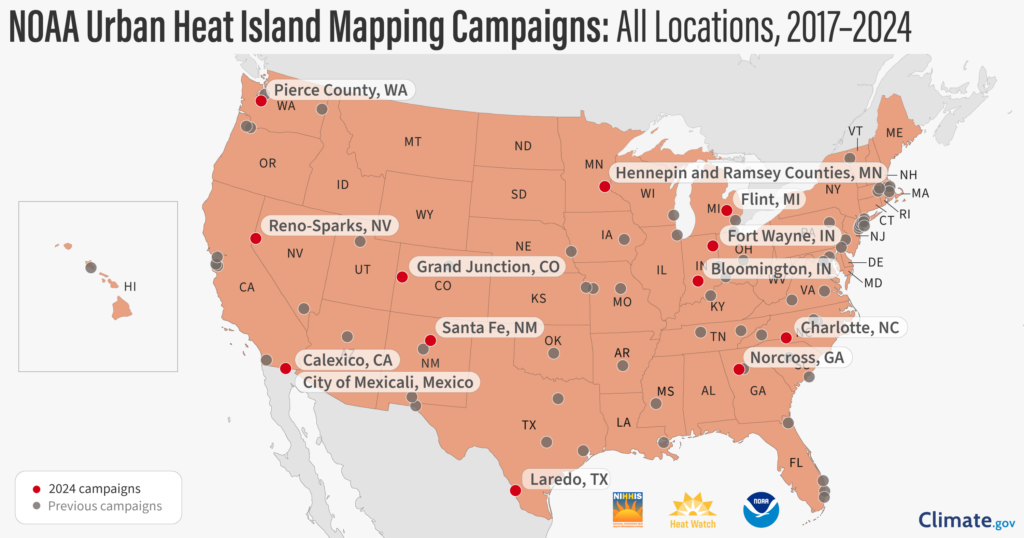
The summer 2024 data collection effort provides community members, legislators, and scientists with detailed maps of the region’s urban heat island. The campaign took place on August 10th, a clear and hot day for our region. The measurements and maps produced from the campaign reveal a great deal of variability across the nearly 200 square miles of our study area and between the early morning, mid-afternoon, and early evening time periods of the study.
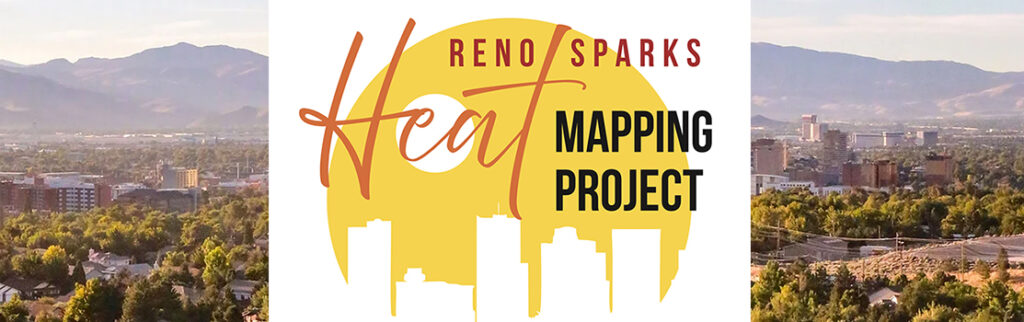
In an effort to better understand urban heat islands and their impacts on our region, a group of organizations, led by the Nevada State Climate Office, is seeking volunteers to track heat on August 10 for the Reno-Sparks Heat Mapping Project. Volunteers will set out in pairs to drive or navigate a predetermined route, equipped with a GPS-equipped temperature and humidity sensor that can be affixed to a volunteer’s car. The original project date was postponed due to unusually cool weather.
Scientists from the Desert Research Institute (DRI) and the University of Nevada, Reno are recruiting volunteers to conduct a one-day campaign to map extreme heat across Washoe County on July 27. community volunteers will fan out across the county to collect thousands of temperature and humidity measurements from early morning through evening, taken over 3 one-hour periods.
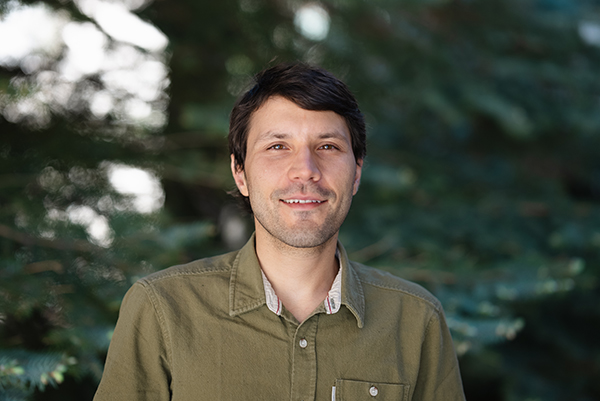
Juan Henao, Ph.D., is a new postdoc in atmospheric sciences working with John Mejia, Ph.D. Originally from Medellin, Colombia, he spent six months on DRI’s Reno campus in 2018 while working with Mejia during his doctoral studies. His primary project will be contributing to atmospheric and air quality modeling efforts, including using digital twins to investigate the effectiveness of urban heat mitigation measures.
Several municipal, county, and Tribal governments and community groups based in the Reno-Sparks area are teaming up to map the hottest parts of Reno, Sparks, and adjacent portions of Washoe County.

John Mejia, Ph.D., is an associate research professor of Atmospheric Modeling at DRI. He was recently awarded a Mid-Career Advancement Award from the National Science Foundation (NSF) to support his research on climate change impacts to urban communities, including urban heat islands and air pollution.

The Desert Research Institute (DRI) and the Houston Advanced Research Center (HARC) announce the launch of a comprehensive extreme heat risk modeling project funded by the National Oceanic and Atmospheric Administration (NOAA) to study and predict the risk of extreme heat within coastal communities.
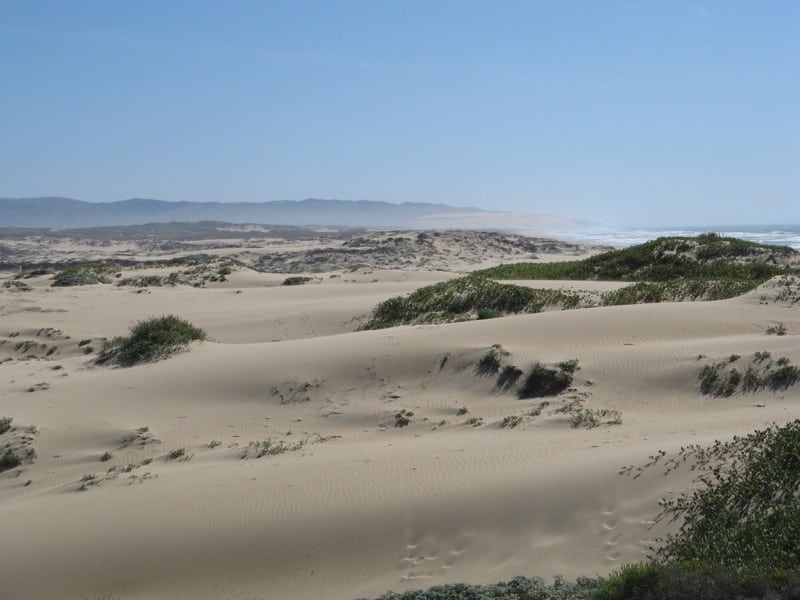
DRI researchers continue a long-term effort to help park officials understand and manage dust emissions from California’s Oceano Dunes.