Scientists Find the First Ice Core From the European Alps That Dates Back to the Last Ice Age
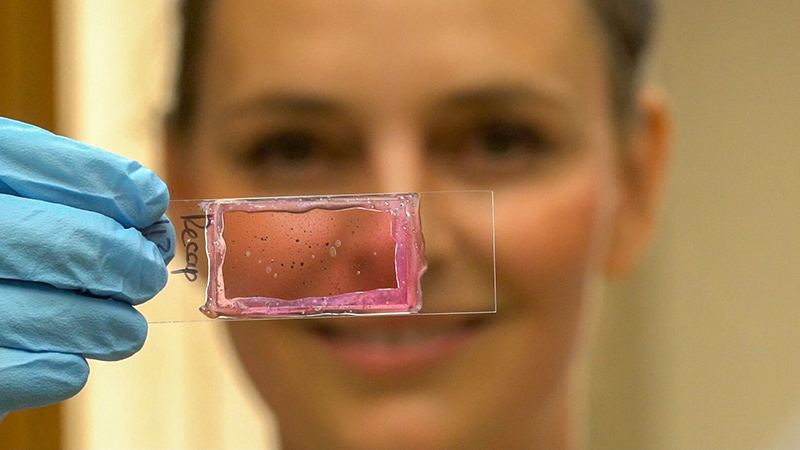
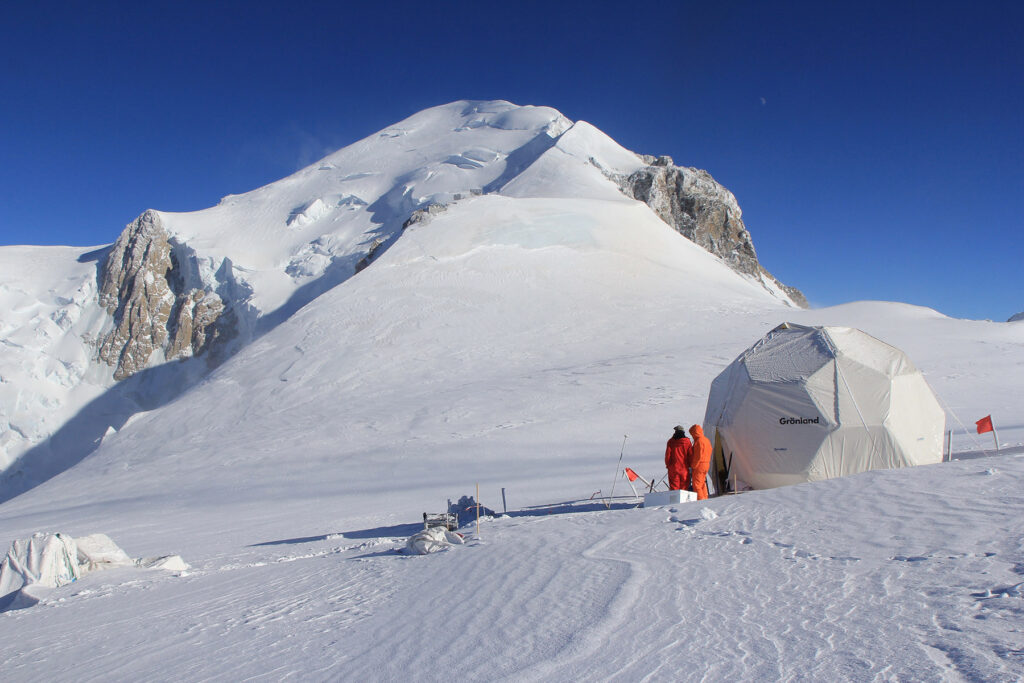
The new study, published in the June issue of PNAS Nexus, examines a 40-meter long ice core from Mont Blanc’s Dôme du Goûter. Using radiocarbon dating techniques, the research team found that the glacier provides an intact record of aerosols and climate dating back at least 12,000 years. Aerosols are small droplets and particles in the air such as desert dust, sea salts, sulfur from volcanic eruptions, soot from forest fires, as well as pollutants and other emissions from human activities.