Detailed future projections for 633 tribal areas focus on agricultural climate variables
By Kelsey Fitzgerald, Native Climate
Earth’s climate future is often discussed in terms of degrees of warming, but for farmers and ranchers, temperature is not the only metric that matters. Other variables such as the number of frost-free days, timing of first snowfall, or changes in spring and summer precipitation are critical to planning future planting, growing, irrigating, and harvesting activities.
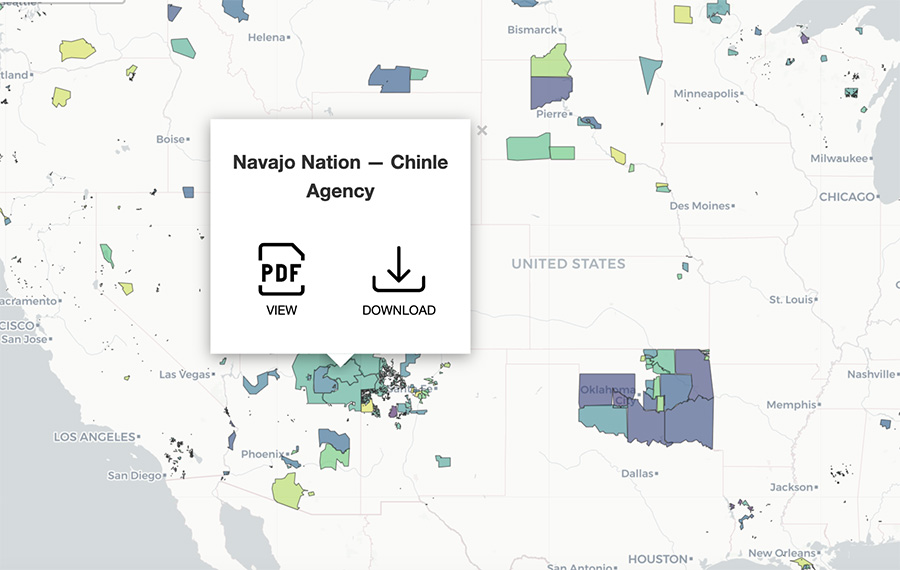
To help Native agricultural producers prepare for the changes to come, Native Climate has compiled detailed local climate projections for 633 tribally controlled areas in the United States, including Alaska Native Villages and State Designated Tribal Areas, and climate divisions for the State of Hawai‘i.
The projections extend through the year 2100 and include twenty-six agricultural climate variables such as temperature, wind speed, growing season length, and precipitation by season. These climate variables were identified through conversations between Native Climate team members and tribal agricultural producers over the course of several years.
“Our tribal partners asked us specific questions in regard to the challenges they are dealing with in agriculture, or how to deal with new information like the impact of heat on human health,” explained Native Climate Program Director Maureen McCarthy, research professor of environmental science at Desert Research Institute. “The new set of projections were created in response to those questions, to provide detailed information about key things that our partners wanted to know more about.”
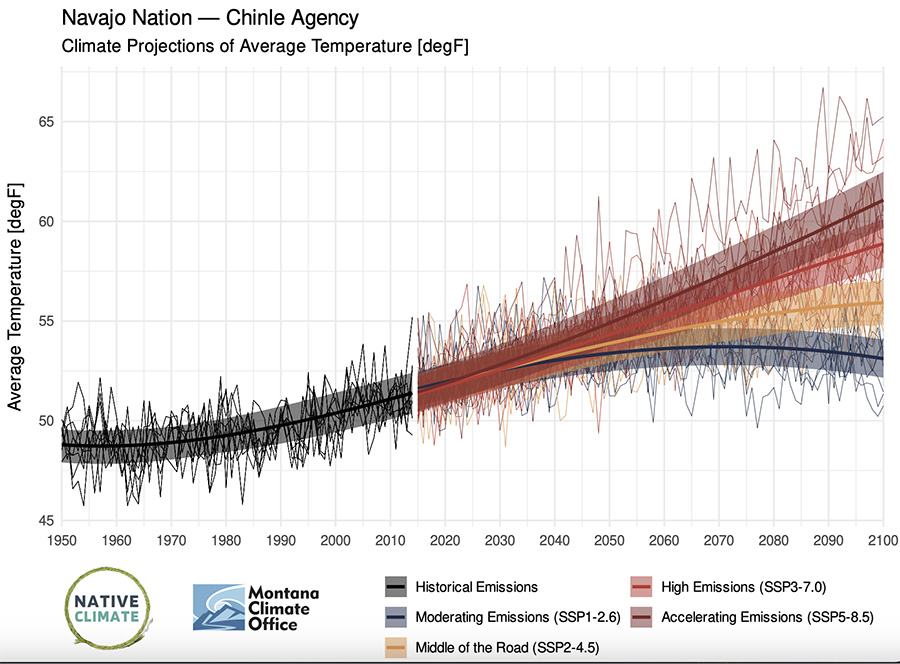
The climate projections were developed by Kyle Bocinsky, Director of Climate Extension for the Montana Climate Office, using data based on the NASA Earth Exchange (NEX) Global Daily Downscaled Projections (GDDP) dataset (NEX-GDDP-CMIP6). The projections include historical data from 1950-present and future conditions under four emissions scenarios and are presented in the form of easy-to-read graphs that can be downloaded from the Native Climate website as PDF files.
“One thing we’ve heard over and over from communities is that they want these data in a format they can drop right into Tribal climate adaption and hazard mitigation plans,” Bocinsky said. “We’ve really worked to provide straightforward access.”
Bocinsky and McCarthy have been sharing the projections with Native communities at workshops and conferences, including the 2024 Extension Risk Management Education (ERME) conference, the National Tribal and Indigenous Climate Conference (NTICC), and the First American Land-Grant Consortium (FALCON) conference. The projections are an evolving resource, McCarthy added; if anyone has a specific climate-related question they would like answered for their region, they can contact Bocinsky and he can model the climate variable they are interested in.
“When we presented in Alaska, for example, the tribes there saw that our projections included ‘number of days over 100oF’ to indicate future heatwaves,” McCarthy said. “They told us that they’re seeing health impacts in their communities if it’s over 70oF. Now we’re doing projections for the Alaska tribes on the number of days over 70oF, so that that gives you an idea of how this is an evolving dataset.”
The Native Climate team encourages use of these projections for many purposes, including climate communication. Participants in Native Climate’s Reporter Program have been incorporating the projections into stories that document climate impacts in their local communities. Other students from tribal colleges and universities have used these projections as a jumping-off point for artwork, children’s books, video projects, card games, and more through the All Climate is Local Project.
The climate projections can be accessed and downloaded via an interactive map on the Native Climate website: https://native-climate.com/projections/. For more information or to request a specific climate variable to be modeled for your region, please contact Kyle Bocinsky, kyle.bocinsky@umontana.edu.
###
Native Climate (https://native-climate.com/) supports climate adaptation efforts in Native American communities of the Southwest and Northern Plains regions by building new connections between Native wisdom and western scientific data. Through two-way information-sharing and relationship-building, Native Climate aims to make climate data more accessible and useful to Tribes in Northern Plains and Southwest Climate Hub regions, and to build awareness nationally about climate impacts and resilience on Native lands. The project is led by the Desert Research Institute in partnership with the Federally Recognized Tribes Extension Program (FRTEP), University of Nevada, Reno Tribal Extension, University of Montana, Montana State University, University of Arizona Extension, and the USDA Climate Hubs. Native Climate is funded by the U.S. Department of Agriculture and builds on the work of the Native Waters on Arid Lands project (2015-2022).
Images: