Preparing Communities for the Future of Wildfire
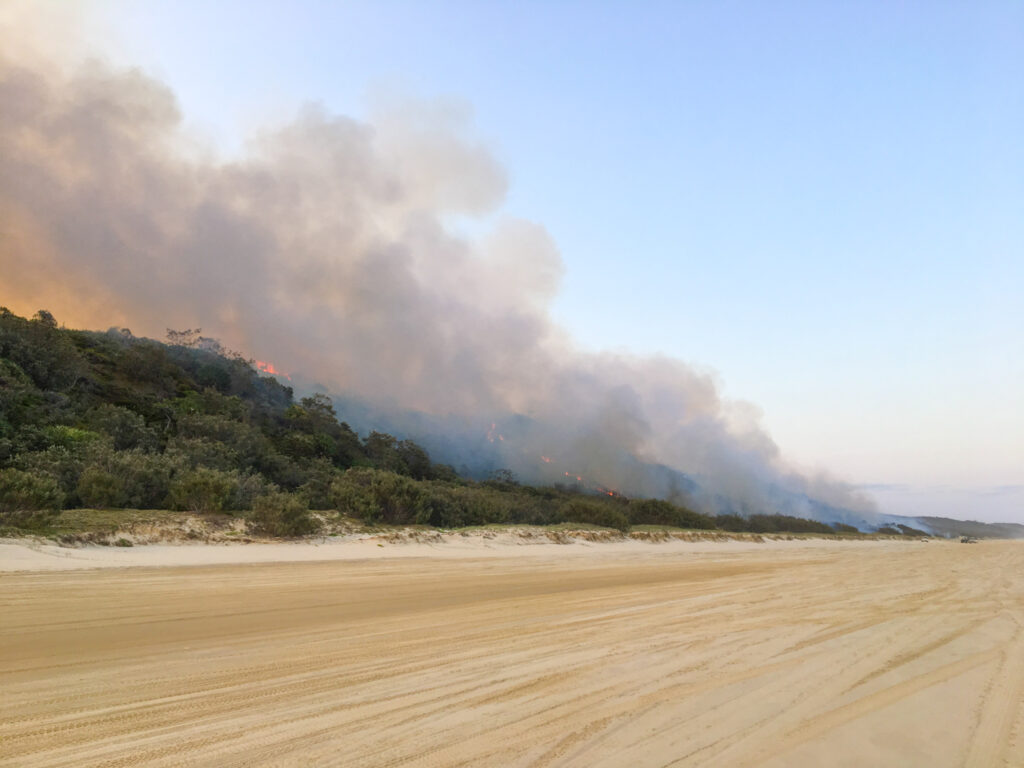
Last year saw DRI’s inaugural global initiative aimed at advancing community resilience and adaptability in the face of rapid global change – AWE+, for an Adaptable World Environment. The event brought together hundreds of scientific experts, policymakers, resource managers, and other stakeholders to discuss ways to strengthen our communities against the growing threat of wildfires. To maintain momentum on the topic and continue building relationships that advance resilience, DRI’s 2025 AWE+ event sought to build on these conversations, again focusing on wildfire and bringing experts together from across the nation.