North American Monsoon
Project Description
The North American Monsoon (NAM) is a large-scale feature having a strong impact on summer rainfall patterns and amounts over North America. For example, it supplies about 60%-80%, 45% and 35% of the annual precipitation for northwestern Mexico, New Mexico (NM) and Arizona (AZ), respectively. Also, anomalously wet NAMs in Arizona are strongly anti-correlated with anomalously dry summers in the mid-west. Although regional climate models have succeeded in reproducing some features of the NAM, its onset, strength and regional extent are not well predicted, and a physical understanding of key processes governing its life-cycle remain elusive.
Here we propose a partial mechanistic understanding of the NAM incorporating local- and planetary-scale processes that quantitatively relates the Gulf of California (GC) sea surface temperatures (SSTs) to the timing, amount and extent of NAM rainfall. The proposed hypothesis is supported with satellite observations of SST, sea surface height (SSH) and rainfall amount; temperature and humidity profiles from ship soundings launched over the GC; climatologies of SST, outgoing longwave radiation (OLR) and 500 hPa geopotential height reanalysis.
A physical understanding of the NAM is needed to guide improvements in regional and global scale modeling of the NAM and its remote impacts on the summer circulation and precipitation patterns over North America. This understanding is also needed to predict the NAM’s response to global warming.
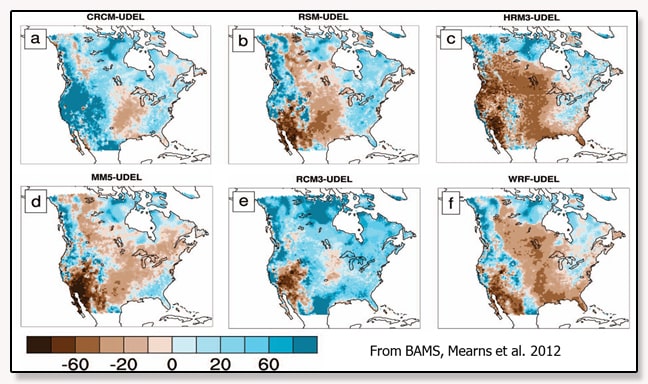
Summer precipitation bias (% difference; model-observation) for regional models indicates that summer rainfall is generally most under-predicted in the NAM region. (shown by several studies).
- Project Overview
- Ocean Currents
- Local-Scale Mechanism
- Large-Scale Mechanism
- Monsoon Modeling
- Monsoon Tracking Tools
Many studies implicate the GC as the dominant moisture source for the monsoon. Our empirical studies of SSTs and NAM rainfall (Erfani and Mitchell, 2014; Mitchell et al. 2002) show that:
1) Monsoon rainfall did not occur prior to the onset of GC SSTs exceeding 26°C, and the incremental advance of SSTs 26°C up the mainland coast of Mexico appears necessary for the northward advance of the monsoon.
2) For the period June–August, 75% of the rainfall in the Arizona–New Mexico region (AZNM) occurred after northern GC SSTs exceeded 29°C, with relatively heavy rains typically beginning 0–7 days after this exceedance.
3) For a given year, SSTs in the southern and central GC reached 29.5°C during a similar time frame, but such warming was delayed in the northern GC. This warming delay coincided with a rainfall delay for AZNM relative to regions farther south.
The figures show the relationship between GC SSTs and NAM rainfall. Further details on our methods and results can be found in our Journal of Geophysical Research (JGR) paper: Erfani and Mitchell (2014), and our Journal of Climate (JC) paper: Mitchell et al. (2002).
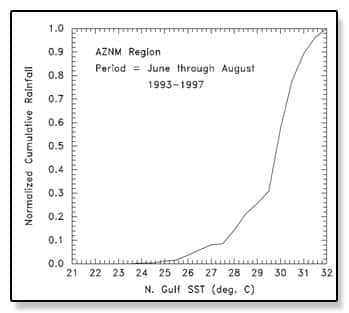
AZNM region cumulative normalized rainfall for periods having N. GC SSTs ≤ indicated SST. Time is implicit with increasing SSTs.
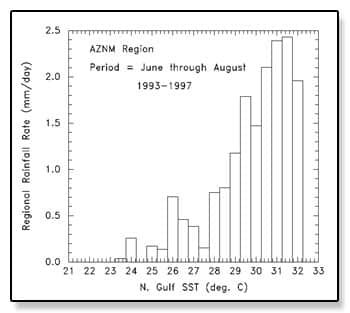
Mean rainfall rates for the AZNM region for N. GC SST intervals of 0.5°C, based on five June–August seasons (Mitchell et al. 2002).
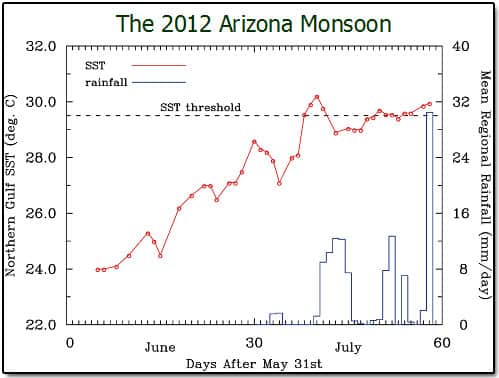
The 2012 Arizona Monsoon
Since Mitchell et al. (2002) was published, we have analyzed 3 other monsoon seasons at higher temporal resolution regarding SST and AZ rainfall amounts, resulting in similar findings. Above is the 2012 analysis. These findings indicate relatively heavy rainfall begins after the mean N. GC SST reaches ~ 29.5°C. On the other hand, relatively heavy convective rainfall occurred in the Great Basin and Arizona during the first days of July in 2013 when the N. GC SST was well below this threshold. Thus, our local scale mechanism may describe the main factors governing the Arizona monsoon onset during most years but not all years (Erfani and Mitchell, 2014).
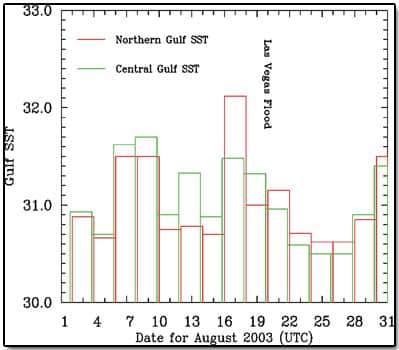
The time evolution of SSTs in 2 different regions of the GC for August 2003. Note that the Las Vegas flood occurs a few days after the warmest northern GC SST.
Since observational, modeling and paleoclimate studies have implicated Gulf of California (GC) sea surface temperatures (SSTs) as critical to the development of the North American monsoon (NAM), it is important to study the ocean processes that affect GC SSTs. The entrance of the GC is a region where two surface currents meet: southward cool waters of the California Current (CC) and northward warm waters of the Mexican Coastal Current (MCC). The interaction of these two currents controls the seasonal variation of surface circulation in this region. Numerical simulations and modern observations found that the northward MCC can be formed locally by the wind stress curl.
In late May or early June, the sea surface height (SSH) topography changes about the time the surface winds in this region slacken, resulting in geostrophic currents that advect tropical surface water into the GC instead of down the coast. The altered circulation in late May-early June may explain the rapid retraction of the 28.5°C isotherm toward the coast in late June, and the corresponding intrusion into the GC, in sharp contrast to SSTs off Baja California that are sometimes ~ 10°C cooler.
The figures below depict the time evolution of SSHs and SSTs. More details can be found in our Journal of Geophysical Research (JGR) paper: Erfani and Mitchell (2014), our Journal of Climate (JC) paper: Mitchell et al. (2002), and our Atmospheric System Research (ASR) meeting poster: Erfani et al. (2013).
Local-scale measurements and modeling
Local-scale measurements and modeling demonstrate that relatively heavy summer precipitation in Arizona generally begins within several days after northern Gulf of California (GC) sea surface temperatures (SSTs) exceed 29°C. The mechanism for this relates to the marine boundary layer (MBL) over the northern GC. For SSTs < 29°C, GC air is capped by a strong inversion ~ 50-200 m above the surface, restricting GC moisture to this MBL. Note SSTs ≥ 29.5°C (i.e. SSTs ≥ threshold SST) correspond with inversion caps 55% in lowest 2 km (this was generally true for higher levels too). So, the inversion generally disappears once SSTs exceed 29°C, allowing MBL moisture to mix with free troposphere. This results in a deep, moist layer that can be advected inland to produce thunderstorms. – More details can be found in the below figures and also in our Journal of Geophysical Research (JGR) paper: Erfani and Mitchell (2014), and in our Atmospheric System Research (ASR) meeting poster: Erfani et al. (2013).
Legend:
GC = Gulf of California | SSTs = Sea surface temperatures | MBL = Marine boundary layer | R/V = research vessel | RH = relative humidity | OD = optical depth |
Analysis of the 2004 Monsoon
The local-scale analysis is based on soundings lauched from a research vessel (R/V) in the Gulf of California (GC) during June and August, 2004, during the North American Monsoon Experiment (NAME). The figure below shows the location of R/V soundings (blue circles) and approximate R/V cruise path (blue lines) in GC (a) during June 2004 and (b) during August 2004 (Erfani and Mitchell, 2014).
The figure below represents a vertical profile of (a) temperature and (b) relative humidity (RH) for 10% of R/V rawinsondes having the strongest inversion cap; and (c) temperature and (d) RH for 10% of R/V rawinsondes having the weakest inversion cap. The black solid lines show the mean profiles; grey shaded areas represent the range of 1 standard deviation from the mean profiles; black dashed lines depict the adiabatic lapse rate. (a) And (b) were associated with the lowest SSTs (~25 °C), whereas (c) and (d) corresponded to the highest SSTs (~ 30 °C) (Erfani and Mitchell, 2014).
The figure below shows idealized soundings summarizing an MM5 modeling study showing the dependence of the MBL inversion on SSTs when the GC SST = 29°C (green) and when the GC SST = 30°C (red dashed)
The figure below shows (a) Dependence of inversion cap on mean SSTs and (b) dependence of low-level RHs on inversion cap based on mean low-level RH for all rawinsondes on board the R/V in the GC north of 24.1°N during June and August 2004. Bars are indicative of standard deviations, and the numbers on data points represent the frequency of data in their bins. Data points with no standard deviation are based on less than three rawinsondes (Erfani and Mitchell, 2014).
Analysis of the 2012 Monsoon
Represented below is 24 hour rainfall amounts for the periods 10 days before (left) and after (right) the SST threshold in the lower 2/3 of the GC was attained.
Below is shown as (a) Relation between SSTs (red) and convective cloud frequency and (b) relation between convective cloud frequency and cloud top height over the NAM core region during 2012 before (red) and after (blue) the SSTs first exceeded 29°C in the lower 2/3 of the GC. Regarding (a), uncertainties were estimated from the difference in mean SSTs for the central and southern GC regions. OD means cloud optical depth.
Large-scale climatologies of North American monsoon
On the large scale, climatologies of North American monsoon (NAM) region, sea surface temperature (SST), outgoing longwave radiation (OLR) and NCEP/NCAR 500 hPa geopotential height reanalysis from 1983 to 2010 support the hypothesis that relatively warm GC (Gulf of California) SSTs (≥ 27.5°C) are generally required for widespread deep convection to initiate in the NAM region, and that the poleward evolution of the NAM anticyclone during June-July is driven by the associated descending air north or north east of the convective region. Indeed, the Rossby wave response to the monsoon latent heating forms a region of adiabatic descent and the anticyclone develops east of monsoon system. As warm Pacific SSTs propagate northwards up the Mexican coastline, deep convection follows this northward advance, advancing the position of the anticyclone. This evolution brings mid-level tropical moisture into the NAM region. More details are provided in our Journal of Geophysical Research (JGR) paper: Erfani and Mitchell (2014), and our Atmospheric System Research (ASR) meeting poster: Erfani et al. (2013).
Legend:
OLR = outgoing longwave radiation |
Below is an animation of SST climatology from 1983 to 2000 provided from NASA/JPL data, courtesy of Miguel Lavin, CICESE. Abrupt poleward advance of warmest water is observed from 10 to 20 June. Northern GC SST is warmer than 29°C from 20 to 25 July. (click to play and click to stop)
Modeling of the 1999 N.A. monsoon onset; the Las Vegas flood
The following modeling results are from the Ph.D. dissertation of Dr. Dorothea Ivanova (Ivanova, D., 2004: Cirrus clouds parameterization for global climate models (GCMs) and North American monsoon modeling study. Ph.D. dissertation, University of Nevada, Reno, 181 pp.). The Arizona/Great Basin onset of the 1999 North American monsoon was simulated using the MM5 regional scale model. This onset also produced a major flooding event in Las Vegas, Nevada. Resolution of the boundary layer was maximized, based on the Hong-Pan (or MRF) boundary layer scheme.
The results generally reproduce the observations under “local scale mechanism”, with the removal of the GC marine boundary layer inversion as SSTs in the northern Gulf of California (GC) approach 30°C. This increased the water vapor mixing ratio at lower levels over the GC and over the southwestern United States, as low-level winds over the northern GC were from the southeast. This in turn increased thunderstorm activity and rainfall amounts over the Southwest. The northern GC SST-rainfall relationship shown under “local scale mechanism” was reproduced in this modeling study.
These results suggest that the proposed local mechanism applies to most Arizona NAM onsets, but 2013 appears to be an exception, as noted under “Overview”. Nonetheless this mechanism appears to be a major contributor of low-level moisture for the NAM.
This section provides links for tracking the evolution of the North American monsoon (NAM) as described in this website. The links may be of interest to anyone interested in the onset and evolution of the NAM in the Arizona-Great Basin region.
1. Advection of tropical surface water into the Gulf of California (GC)
2. Wind and moisture fields showing moisture transport out of the GC
3. Infrared satellite imagery for deep convection
4. Northern GC SST-rainfall relationship
Sea surface temperatures (SST)
- Eastern Pacific sea surface temperatures
- Ocean Watch
Provides ocean data including SST in the Pacific region. - Current State of the Ocean (SOTO)
This website represents real-time data that is displayed on a virtual globe (by Google earth) and provides data layers for SST, wind vectors, ocean color and some other variables.
Satellite rainfall estimates
- Real-time rainfall estimates over the Continental United States
- Real-time rainfall estimates over the Mexico, Central America and the Caribbean
- Advanced Hydrologic Prediction Service (AHPS) Precipitation Analysis
This webpage depicts the current and archived observational precipitation across United States. - USA rainfall estimates from National Weather Service (NWS) radar
Other websites
CONTACT
David Mitchell, Ph.D.
Project Director
David.Mitchell@dri.edu
LOCATION
Desert Research Institute
2215 Raggio Parkway
Reno, NV 89512
DIVISION
Atmospheric Sciences